The Google Books Ngram Viewer shows the frequency of occurrences of the words over the duration specified (from 1700-2008) in the various books scanned by Google. This is pretty cool, and one doesnt have to download all the book information and then do a frequency analysis. Also the viewer supports multiple words to be specified and see how they trend over the years.
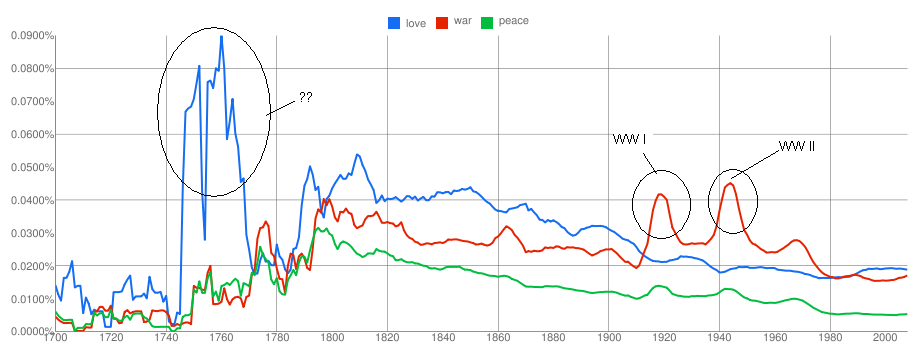
I quickly tried checking the trend for the words 'love', 'war' and 'peace' and following is the visualization of the same . You can view the chart and also play around with it(and other words ) with Google Labs Books ngram Viewer here.
I am not sure what exactly happened during 1740 to 1770; to my limited knowledge 1760s saw Industrial Revolution. The spikes in the word 'war' during 1910s and 1940s correspond to the World Wars raging on then. Did you notice that 'war' is again trending up and 'love' and 'peace' are going down?
On a closer look, this looks to me like a direction reversal for 'war' and is it possible that we are going to see some bloodshed soon? Notice, that whenever there has been a direction reversal in the 'war' trend, there has been a war.
Some more trend here , here , here and here . Any other interesting words/phrases to be visualized?
December 19, 2010
Mozilla Open Data Visualization Entry-3
This is my 3rd Entry to the Mozilla Open Data Visualization Competition.
My 1st entry can be found here.
My 2nd entry can be found here.
In this entry , I have to tried to analyse how the age factor affects the usage of three of the features in Firefox 4, namely - Keyboard Shortcuts, Search and the new feature - Panorama. For this analysis, i used the small dataset from "Firefox 4 Beta Interface - Version 2". The following chart presents the data grouped as per the feature and shows the % usage of different age groups.
Also, I have presented the top 3 often used keyboard shortcuts that are used by different age groups. In this, i have preferred a tabular layout, as i feel that data of this nature is best visualized using a tabular format(it is not necessary that every visualization needs to be presented
in some bar or pie chart :)).
The analysis does find that 18-25 and 26-35 age groups are the maximum adopters of the Panorama, Search and Keyboard shortcuts.
Also, it is observed that 'new tab', back', and 'find' are widely used by the younger audience. The usage of the 'back' and 'new tab' keyboard shortcuts drops as the age of the audience increases.
My 1st entry can be found here.
My 2nd entry can be found here.
In this entry , I have to tried to analyse how the age factor affects the usage of three of the features in Firefox 4, namely - Keyboard Shortcuts, Search and the new feature - Panorama. For this analysis, i used the small dataset from "Firefox 4 Beta Interface - Version 2". The following chart presents the data grouped as per the feature and shows the % usage of different age groups.
Also, I have presented the top 3 often used keyboard shortcuts that are used by different age groups. In this, i have preferred a tabular layout, as i feel that data of this nature is best visualized using a tabular format(it is not necessary that every visualization needs to be presented
in some bar or pie chart :)).
The analysis does find that 18-25 and 26-35 age groups are the maximum adopters of the Panorama, Search and Keyboard shortcuts.
Also, it is observed that 'new tab', back', and 'find' are widely used by the younger audience. The usage of the 'back' and 'new tab' keyboard shortcuts drops as the age of the audience increases.
December 18, 2010
Mozilla Open Data Visualization Entry-2
This is my second entry to the Mozilla Open Data Visualization competition. You can find my earlier entry here.
This Entry tries to analyse how people spend time on the Web. In this entry too, i have tried to analyse on four fronts. [But these are generic compared to my previous entry - i.e, my previous entry was more w.r.t users and their relationship with Firefox; whereas this Entry is mainly related to the user's general behavior - which were obtained from the Firefox Survey. Nevertheless, this analysis does give some insights into various facets of user-web interaction]
1) Does the knowledge of Computer or the Web affect the way users visit various websites?
2) How do people come to know about the latest computer technology and trends?
3) What is the phone ownership pattern of the users who own a smartphone?
4) On what kind of websites do people spend their time?
[I have deliberately avoided explaining the interpretations and understandings - as I believe that the numbers speak for themselves. However, any doubts in the charts can be explained]
My 1st Entry to this competition can be found here.
My 3rd Entry to this competition can be found here.
This Entry tries to analyse how people spend time on the Web. In this entry too, i have tried to analyse on four fronts. [But these are generic compared to my previous entry - i.e, my previous entry was more w.r.t users and their relationship with Firefox; whereas this Entry is mainly related to the user's general behavior - which were obtained from the Firefox Survey. Nevertheless, this analysis does give some insights into various facets of user-web interaction]
1) Does the knowledge of Computer or the Web affect the way users visit various websites?
2) How do people come to know about the latest computer technology and trends?
3) What is the phone ownership pattern of the users who own a smartphone?
4) On what kind of websites do people spend their time?
[I have deliberately avoided explaining the interpretations and understandings - as I believe that the numbers speak for themselves. However, any doubts in the charts can be explained]
My 1st Entry to this competition can be found here.
My 3rd Entry to this competition can be found here.
December 17, 2010
India ZIPScribble Maps
And it so happens that i managed to get a handle on all the zip codes in India and their corresponding longitudes-latitudes. This is what you get when you connect all the zipcodes in India :
And then when you order the long-lat pairs :
The next in this series is going to be :
1) Calculate the total distance travelled when you connect all the zipcodes (from map#1).
2) Do a TSP(Travelling Salesman Problem) on the zipcodes (from #1 above) and plot the route. Calculate the distance.
3) Do #2 for each of the states. (this "can" be used when you are planning your travel)
And then when you order the long-lat pairs :
The next in this series is going to be :
1) Calculate the total distance travelled when you connect all the zipcodes (from map#1).
2) Do a TSP(Travelling Salesman Problem) on the zipcodes (from #1 above) and plot the route. Calculate the distance.
3) Do #2 for each of the states. (this "can" be used when you are planning your travel)
December 16, 2010
Mozilla Open Data Visualization Competition
The following are the results of my analysis of the data from the Mozilla Open Data Visualization Fall 2010 contest. I downloaded witl_small.tar.gz (from "A Week in the Life of a Browser - Version 2" ) which contains a sample of the data for my analysis.
I did not download the full set as my bandwidth has been crappy for sometime and also was running out of time. (The queries can be run on the FULL data though.) Mozilla has provided many attributes related to the various activities on FF (and there are SO MANY of them!). Since i stumbled on this contest pretty late in the game, i was unable to analyse ALL the attributes/dimensions. I preferred tackling a few questions in good detail than analysing many dimensions without much depth.
So my analysis consists of the following 4 visualizations which try to answer 4 different questions.
Tools Used : Protovis, HighCharts, Python, SQLite3 (Excel was used for Preliminary analysis/data cleansing)
1) What is the Web usage pattern of people of different age groups?
Or in other words, What is the average number of hours spent by someone who is 30 years old?
2) Is their a correlation between the number of years being associated with Firefox and the number of hours spent on the Web daily?
or in otherwords, do people who have used Firefox for 3-5 years or more, spend more number of hours using the Web Daily?
3) What kind of bookmark activity do people do who are associated with Firefox for a number of years(we analyse *only* those who use any of the bookmark feature)
i.e, how is the bookmarking creation/choosing/modifying spread among the bookmarking operations?
(In the above chart, you will find 3-6m column being empty - the reason being, there was no data for this in the sample - i hope that the same is present in the full data set).
4) How do different age groups function w.r.t various features on the Firefox?
Note: this chart is to be read vertically - i.e, for a given feature, lets say Private Mode, which is the age group which uses this feature often? You will find that on viewing the column Privatemode, the age group 18-25 has the darkest color, which means that this is the age group which uses the feature often. Hence, the color gradient from the lightest to the darkest encodes the least to most often used.
[I have deliberately avoided explaining the interpretations and understandings - as I believe that the numbers speak for themselves. However, any doubts in the charts can be explained]
My 2nd entry to this competition can be found here.
My 3rd entry to this competition can be found here.
I did not download the full set as my bandwidth has been crappy for sometime and also was running out of time. (The queries can be run on the FULL data though.) Mozilla has provided many attributes related to the various activities on FF (and there are SO MANY of them!). Since i stumbled on this contest pretty late in the game, i was unable to analyse ALL the attributes/dimensions. I preferred tackling a few questions in good detail than analysing many dimensions without much depth.
So my analysis consists of the following 4 visualizations which try to answer 4 different questions.
Tools Used : Protovis, HighCharts, Python, SQLite3 (Excel was used for Preliminary analysis/data cleansing)
1) What is the Web usage pattern of people of different age groups?
Or in other words, What is the average number of hours spent by someone who is 30 years old?
2) Is their a correlation between the number of years being associated with Firefox and the number of hours spent on the Web daily?
or in otherwords, do people who have used Firefox for 3-5 years or more, spend more number of hours using the Web Daily?
3) What kind of bookmark activity do people do who are associated with Firefox for a number of years(we analyse *only* those who use any of the bookmark feature)
i.e, how is the bookmarking creation/choosing/modifying spread among the bookmarking operations?
(In the above chart, you will find 3-6m column being empty - the reason being, there was no data for this in the sample - i hope that the same is present in the full data set).
4) How do different age groups function w.r.t various features on the Firefox?
Note: this chart is to be read vertically - i.e, for a given feature, lets say Private Mode, which is the age group which uses this feature often? You will find that on viewing the column Privatemode, the age group 18-25 has the darkest color, which means that this is the age group which uses the feature often. Hence, the color gradient from the lightest to the darkest encodes the least to most often used.
[I have deliberately avoided explaining the interpretations and understandings - as I believe that the numbers speak for themselves. However, any doubts in the charts can be explained]
My 2nd entry to this competition can be found here.
My 3rd entry to this competition can be found here.
December 15, 2010
ChronoDrop - Visualizing Events
I always liked Subway Maps - they are easy to understand and also look visually pleasing. And then i stumbled on the following visualization wherein Subway Maps are used to show the Acquisitions that Google had made over the past few years. The graph does look good, and shows the domain of the firm by color coding the 'route'.
But this graph suffers from a BIG defect : it does not show the 'time' factor; as in, we do not know the sequence in which Google acquired the companies. Also, it does not show the amount shelled out by Google in acquiring each of the firms. And I wanted to rectify this by choosing a better medium.
I am not a designer and my illustration skills are very limited. Hence i mostly restrain myself to charts and graphs than creating a kicka$$ poster or infographics illustration. But, the problem was very interesting and i thought i would take a dig at this and also see how good I am with some illustration skills.
I devised ChronoDrop - a visualization technique to group and order events that have an associated time factor. Assumption being, the events do not belong to multiple groups(/domains) and are to be represented in a timeline. So, in this case, a company cannot belong to both Social and Technology - we demarcate the separation in strict terms so that the readability is enhanced.
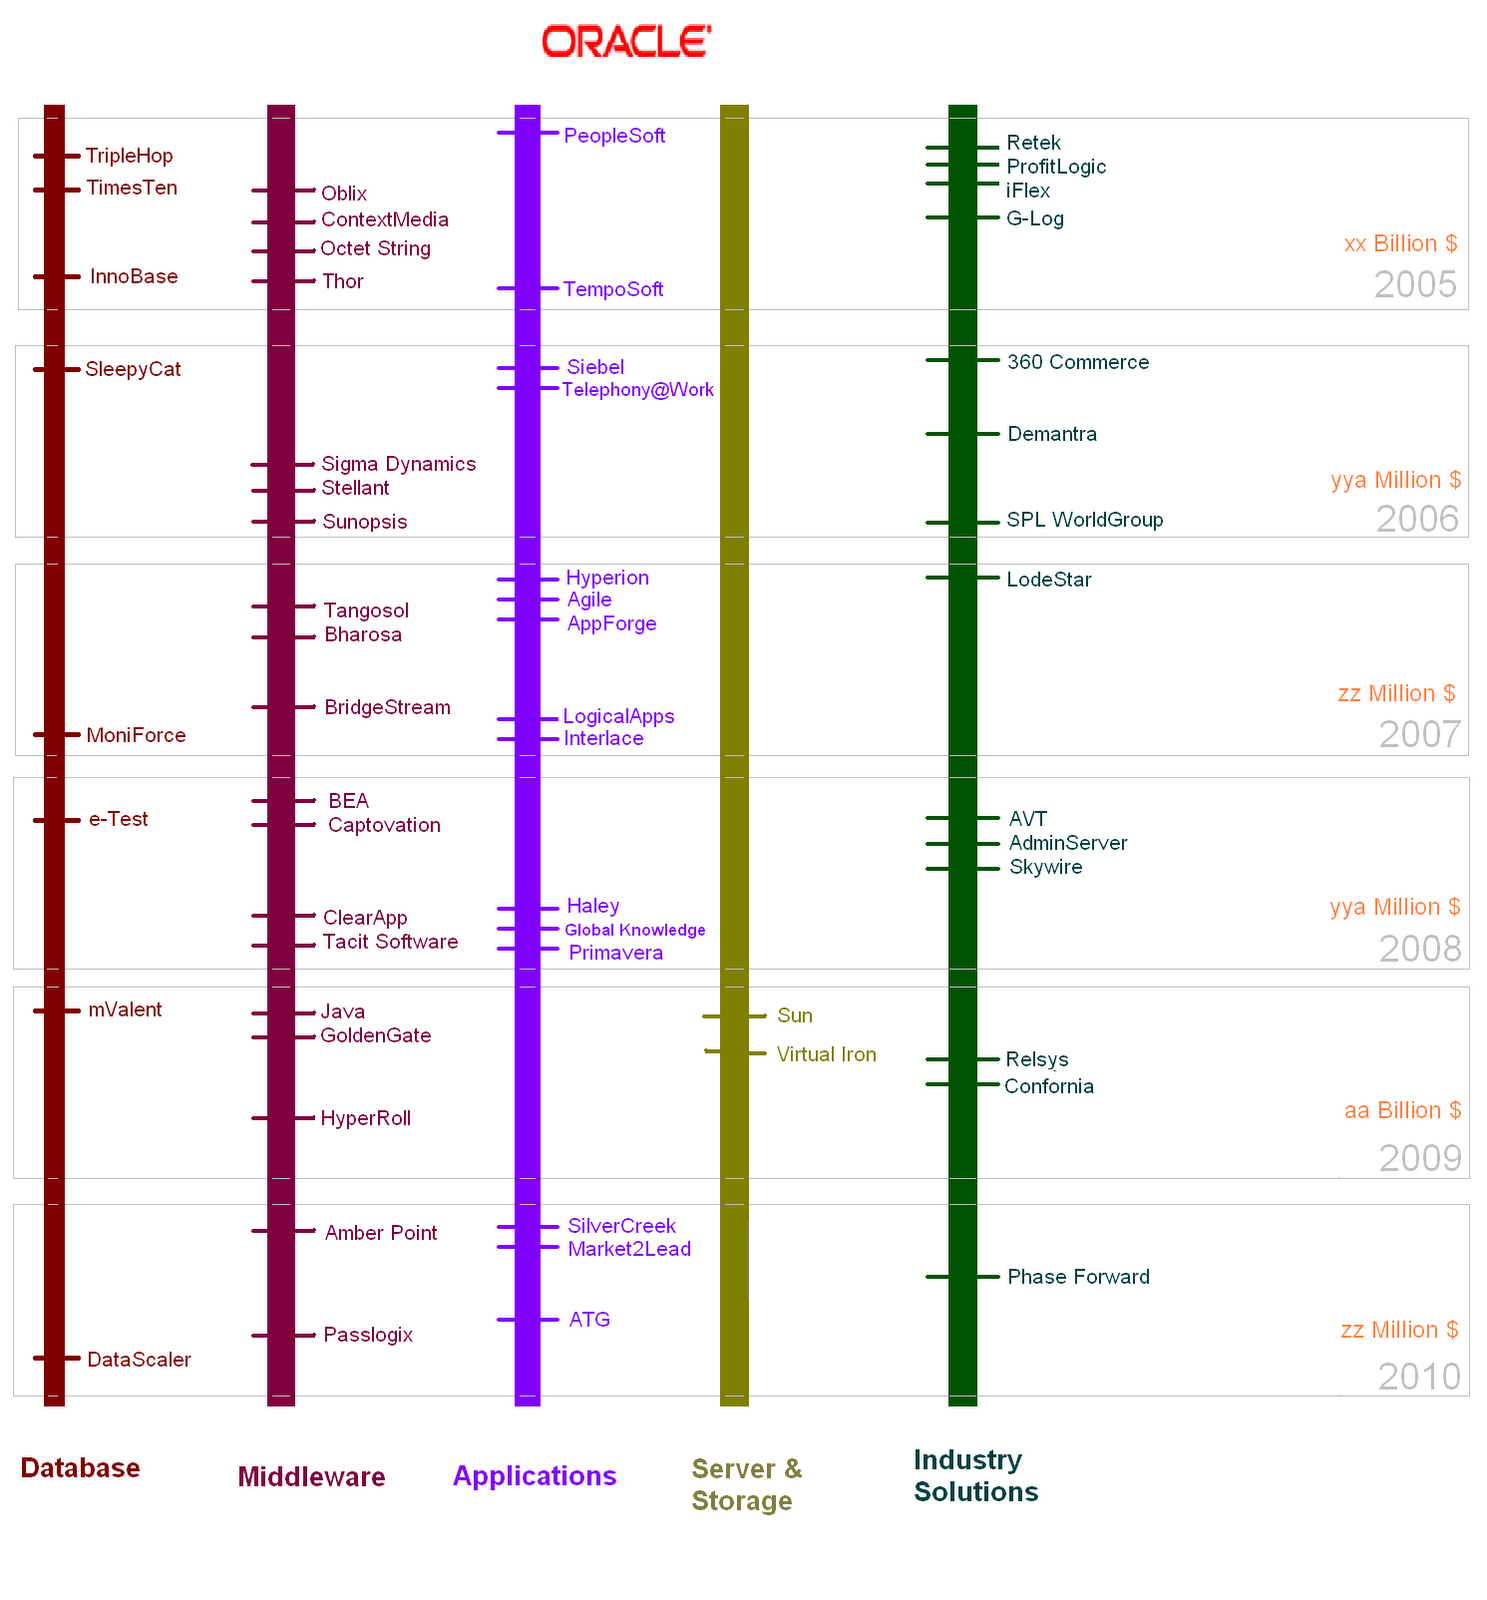
In the following illustration, I used ChronoDrop to show the acquisitions that Oracle has done since 2005. The companies are divided based on the domain - like, databases, middleware etc.
Why did i call it ChronoDrop?
- Well, 'chronos' personifies time and i wanted this representation to be based on events which are spread across time.
- And why Drop? I always preferred scrolling down than scrolling horizontally. How many times do we scroll horizontally? In fact, good UI designers despise horizontal scrolling; i have seen numerous instances, wherein presence of a horizontal scrollbar is loathed upon (more than that, horizontal scrolling is just a BIG pain in the a$$).
Some more modifications could be done to ChronoDrop, like,
1) making the font of the Company name scale according to the amount spent on acquiring it. I wouldn't prefer logos, as images can cause a quadratic change (also they become quiet inefficient unless/otherwie the graphic is to be printed as a poster).
2) If animation was possible, then we can show the Date of acquisition(and any other details) when the mouse is hovered over the company name (hyperlinks are always possible). I did not want to display the amount in the 'static' image, as I did not want to clutter the viz.
3) The amount spent on the acquisition can be shown in the static image, but this requires some illustration skills which i do not readily possess. For eg. If we can increase the image size, then we can easily accomodate the cost factor beneath the organization name.
Something that i liked about ChronoDrop is that, this graph can be generated programmically pretty easily. I hope to generate a library for this sometime.
Well, i do not think ChronoDrop is a game changing technique/representation in the visualization field, but this my FIRST attempt at designing/conceptualizing a medium in this arena.
Probably, some more useful illustrations of ChronoDrop :
- IMDB's top 250 movies based on genre grouped by release dates.
- Comparing the tenures of the US Presidents with that of Indian Prime Minsters; scams during the respective tenures could be interspersed.
- Sporting events(cricket, football, hockey, archery, tennis, badminton) over decades
- Various Natural Calamities(Earthquakes, Typhoons, Floods/Landslides, Volcanos) over decades.
But this graph suffers from a BIG defect : it does not show the 'time' factor; as in, we do not know the sequence in which Google acquired the companies. Also, it does not show the amount shelled out by Google in acquiring each of the firms. And I wanted to rectify this by choosing a better medium.
I am not a designer and my illustration skills are very limited. Hence i mostly restrain myself to charts and graphs than creating a kicka$$ poster or infographics illustration. But, the problem was very interesting and i thought i would take a dig at this and also see how good I am with some illustration skills.
I devised ChronoDrop - a visualization technique to group and order events that have an associated time factor. Assumption being, the events do not belong to multiple groups(/domains) and are to be represented in a timeline. So, in this case, a company cannot belong to both Social and Technology - we demarcate the separation in strict terms so that the readability is enhanced.
In the following illustration, I used ChronoDrop to show the acquisitions that Oracle has done since 2005. The companies are divided based on the domain - like, databases, middleware etc.
Why did i call it ChronoDrop?
- Well, 'chronos' personifies time and i wanted this representation to be based on events which are spread across time.
- And why Drop? I always preferred scrolling down than scrolling horizontally. How many times do we scroll horizontally? In fact, good UI designers despise horizontal scrolling; i have seen numerous instances, wherein presence of a horizontal scrollbar is loathed upon (more than that, horizontal scrolling is just a BIG pain in the a$$).
Some more modifications could be done to ChronoDrop, like,
1) making the font of the Company name scale according to the amount spent on acquiring it. I wouldn't prefer logos, as images can cause a quadratic change (also they become quiet inefficient unless/otherwie the graphic is to be printed as a poster).
2) If animation was possible, then we can show the Date of acquisition(and any other details) when the mouse is hovered over the company name (hyperlinks are always possible). I did not want to display the amount in the 'static' image, as I did not want to clutter the viz.
3) The amount spent on the acquisition can be shown in the static image, but this requires some illustration skills which i do not readily possess. For eg. If we can increase the image size, then we can easily accomodate the cost factor beneath the organization name.
Something that i liked about ChronoDrop is that, this graph can be generated programmically pretty easily. I hope to generate a library for this sometime.
Well, i do not think ChronoDrop is a game changing technique/representation in the visualization field, but this my FIRST attempt at designing/conceptualizing a medium in this arena.
Probably, some more useful illustrations of ChronoDrop :
- IMDB's top 250 movies based on genre grouped by release dates.
- Comparing the tenures of the US Presidents with that of Indian Prime Minsters; scams during the respective tenures could be interspersed.
- Sporting events(cricket, football, hockey, archery, tennis, badminton) over decades
- Various Natural Calamities(Earthquakes, Typhoons, Floods/Landslides, Volcanos) over decades.
Around the World in 14 Hops
"Boredom leads to inspiration". One uneventless bored noon is enough to do anything - and i went world hopping; and it takes only 14 hops - with one of them being tracing the same route(9,10).
Just if you missed noticing, the above map appears on Facebook login page.
December 14, 2010
Scribble Map
I was looking for possible visualizations using maps on the Internet; thinking as to how people would be using lat/long details to present information. One obvious example would be use maps to show the sales/revenue spread across the various LoBs of an organization. Many enterprises capture the spatial information and display along with the 'regular' data(sales/revenue..etc etc). By the way, spatial maps, however simple they might sound are very important to bring a breath of fresh air into an otherwise uninspiring presentation of Enterprise data - you no longer work with tables, but directly on the map-region wherein the action is taking place.
But was there more that can be done with maps? Anything more funny and hackworthy? And then i stumbled on ZIPScribbleMaps - i found this extremely interesting; especially for a country like India which is huge and diverse, some visualization w.r.t Pin codes (or Zip codes) would be neat.
I quickly searched the web for a complete list of India Pin Codes, but it was quiet funny that i was not able to find it anywhere. You have to pay to get this information - especially if you want the zipcodes along with the lat/long information. (I think Govt should opensource this).
The following shows the ZIPScribble map for the state of Andhra Pradesh (I will do this for the rest of the Indian States soon - probably this weekend).I used the Google Maps API v2 and plotted the polylines between the pin codes, and this is what you have :
The first map shows the scribble, when all the pincodes are arranged in ascending order and lines are drawn between two consecutive postal codes.
The Second map shows the scribble, when we remove the duplicate lat-long pair and arrange them in ascending order (So that a PIN is not repeated).
But was there more that can be done with maps? Anything more funny and hackworthy? And then i stumbled on ZIPScribbleMaps - i found this extremely interesting; especially for a country like India which is huge and diverse, some visualization w.r.t Pin codes (or Zip codes) would be neat.
I quickly searched the web for a complete list of India Pin Codes, but it was quiet funny that i was not able to find it anywhere. You have to pay to get this information - especially if you want the zipcodes along with the lat/long information. (I think Govt should opensource this).
The following shows the ZIPScribble map for the state of Andhra Pradesh (I will do this for the rest of the Indian States soon - probably this weekend).I used the Google Maps API v2 and plotted the polylines between the pin codes, and this is what you have :
The first map shows the scribble, when all the pincodes are arranged in ascending order and lines are drawn between two consecutive postal codes.
The Second map shows the scribble, when we remove the duplicate lat-long pair and arrange them in ascending order (So that a PIN is not repeated).
December 13, 2010
Hollywood movies Visualization -Trilogy Meter
Spent some time scraping the data from IMDB - ended up manually scraping the data for the 10 movie trilogies that I always liked. This was more of a personal project as in I wanted to see how trilogies fared - in terms of budget, revenues and the final ratings that the users provide. The rating shown is the rating of that particular part of the trilogy on 12-Dec-2011 from IMDB.
Each of the bars in each of the graphs of Budget,Ratings and Gross Revenue denote a part of the respective trilogy, with the leftmost bar being part 1, mid being part 2 and the right bar being part 3.
December 12, 2010
December 10, 2010
World's Billionaires Visualization
I always wanted to be RICH (just like everyone else) :)
There are 1101 Billionaires in the World in the year 2010 as released by Forbes Magazine. Now, I have the data and some interesting patterns can be deciphered. Some visualizations from the data set.
Spread of Billionaires across Age Groups:
Spread of Billionaires across Countries would be a usual visualization. So here is a quick heatmap of the same. I used openheatmap to create this - i would have ideally preferred that i am able to choose the colors so that the gradients are more pronounced and show the spread (but alas!). You can also interact with this map in here.
The Forbes list also gives the details of the Citizenship and the Residence of the Billionaires. This data can be used to find out the pattern here; i.e, find out the billionaires whos Country of Citizenship is not the same as Country of Residence; or try to find out how the countries of Residence and Citizenship correlate; which is the thickest arc in the data which links two countries? (though i would have preferred that clicking on the arc leads shows some useful tooltip, but i was not able to find that option in Protovis).
Also, some interesting facts came out of the data:
- There are 8 'couples' - as in, set of 2 persons whose combined assets touch 1billion or more.
- Of the 1101 names, there are 105Families; the total asset value of these 105 Families is 2990.4 Billion $. Top 3 countries having the rich families : US(25), China (9), India (7).
- The combined wealth of all the Billionaires is close to 3567.8 Billion $.
- Top 5 Countries measured in terms of the highest net worth of the Billionaires: USA(1349.3), Russia(265), India (222.1), Germany(217.7), China(133.2). (Again, this data can be showed as a heat/choropleth map, but i did not want to overdo on this viz).
- One more interesting observation would be to find out how age and the wealth work together. So, i quickly divided age by wealth to find out the most 'successful' - 'Success' here is defined as those whose age/wealth factor is as close to 1. And i found that top 5 on this race are :
- William Gates III (Rank:2, Age:54, Worth:53, Success Factor:1.0)
- Carlos Slim Helu & family (Rank:1, Age:70, Worth:53.5, Success Factor:1.3)
- Warren Buffett (Rank:3, Age:79, Worth:47, Success Factor:1.7)
- Mukesh Ambani (Rank:4, Age:52, Worth:29, Success Factor:1.8)
- Eike Batista (Rank:8, Age:53, Worth:27, Success Factor:2.0)
The following visualization was more of a fun factor. It shows the tag cloud of the names of all the Billionaires in the world. The font size shows how frequent some of those names occur.
December 07, 2010
Data Visualization Fail # 2
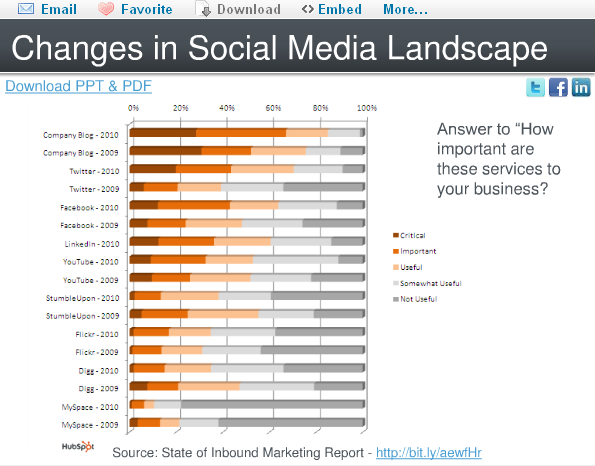
In the following set of charts i have tried to highlight some 'pain' points and also suggest how these charts can be made more attractive without sacrificing the 'data quality'. All the charts were obtained from the presentation present here. I stumbled on this presentation at Slide Share which has a few marketing charts, and i think i can use this to present some of the visualization gotchas or chartjunk.
Again, the idea is not to criticize the author of these charts but valuable suggestions on how to make 'beautiful' presentations from the same set of data. Due to lack of time, i am not able to generate the equivalent 'beautiful' charts, but would definitely present the suggestions.
Chart 1:
a) Background grid lines can be removed
b) Since the value associated with the bar is already displayed at the top of the bar, i wouldnt necessarily be having a Y-axis.
c) I would prefer a Tufte Graph for this - makes more sense as the number of bars are less.
d) The color chosen is good and also the axis descriptions are neat.
Chart 2:
a) Though there are only two pie charts being used here, and each of them has only 3 regions, we might think that probably it fits the use-case here, but i feel a set of histograms or line graph would make this even beautiful.
b) I would always suggest a Tufte Graph when the number of regions is very less and there are not many dimensions to be considered.
(There is nothing 'criminally' wrong in using pie chart here)
Chart 3:
a) Two pie charts with many regions!!!
b) Color chosen are not good.
c) Colors do not show the intention - on the first glace it looks to me that Direct Mail, Trade Shows and Telemarketing are to be clubbed together and so be "Email Marketing" and "Other" & PPC and SEO - i think this is a strict NO-NO.
d) Prefer a simple bar graph.
e) Also there a BIG chart ERROR : In the 2009 graph, we see Blogs and Social media in ONE pie which comprises 9% whereas in 2010 graph, these two are divided into two pies. ~dumph~
Chart 4:
a) The hort.stacked bar chart is an overkill here.
b) Tough to read
c) The % scale on the hort axis does not make sense to me. Would have preferred the number to be present in each of the 'pieces' of the bar.
Chart 5:
a) Date Format - me being from the Indian Subcontinent, i always have a trouble when date format is given to me in xx/xx/yyyy format - i am not sure whether the first xx is a month or date. I always prefer the dd-mmm-yyyy or dd-mmm'yy format. In this kind of a graph, where growth rate is to be shown, mmm-yy would have been perfect.
b) Rather than chosing the Growth Rate, i would preferred the number of active users on the Y-axis. This is a small nit.
c) Clustering on a Q-on-Q basis would also have been better.
December 05, 2010
Data Visualization - Charts and Libraries
When i was searching the net for possible Data Visualization libraries i stumbled on many. The following are some of the charting libraries that i have compiled from the Internet (i got the main ones from the following two links : here and here .) I have lifted the text associated with the libraries from these 2 links; however i will reviewing them personally too, as and when time permits.
I will be updating when i stumble on any library that is interesting; libraries that can be quickly learnt and used. I will mainly be concentrating on Free libraries. Please do add a comment if you want to recommend anything interesting too.
At this moment I want to thank all the authors/designers who are behind these libraries and have contributed significantly to the data visualization arena.
Ajax.org
Ajax.org Platform is a pure javascript application framework for creating real-time collaborative applications that run in the browser.
http://www.ajax.org/
AnyChart
AnyChart is a flexible Flash based solution that allows you to create interactive and great looking flash charts.
http://www.anychart.com/products/anychart/gallery/
Axiis
Axiis is a Data Visualization Framework for Flex. It has been designed to be a concise, expressive, and modular framework that let developers and designers create compelling data visualization solutions.
http://www.axiis.org/
BirdEye
BirdEye is a community project to advance the design and development of a comprehensive open source information visualization and visual analytics library for Adobe Flex. The actionscript-based library enables users to create multi-dimensional data visualization interfaces for the analysis and presentation of information.
http://birdeye.googlecode.com/svn/branches/ng/examples/demo/BirdEyeExplorer.html
Bluff
Bluff is a lightweight charting library that ports Ruby’s Gruff gem to JavaScript. Weighing at only 11KB gzip’ed (you also need JS.Class which only weighs 2.6KB gzip’ed), it’s surprising that you’ll be able to get 15 different types of charts out of this library. It features tooltips, a ton of configurable options, legend support, and the .set_theme method for declaring reusable themes.
http://bluff.jcoglan.com/
Degrafa
Degrafa is a declarative graphics framework for creating rich user interfaces, data visualization, mapping, graphics editing and more.
http://www.degrafa.org/samples/data-visualization.html
DojoX Data Chart
An addition in the Dojo 1.3 release is the new dojox.charting class. Its primary purpose is to make connecting a chart to a Data Store a simple process.
https://user.sitepen.com/~mwilcox/Chart/DataChart.html
Chronoscope
If you need to visualize thousands or millions of points of data, check this out. Very well designed and can be navigated with the keyboard or mouse. There's a Javascript API, a Google Visualization API or try it as a Google Gadget on Google Spreadsheets, iGoogle, or Open Social.
http://timepedia.org/chronoscope/
Dundas
Dundas has a wide range of data visualization solutions for Microsoft technologies. They offer a number of data visualization tools including: Chart, Gauge, Map and Calendar for .net and Dashboards for Silverlight.
http://www.dundas.com/Components/Gallery/ASP/
Dygraph
dygraphs is a JavaScript library for producing interactive charts for time series data. It was designed to plot dense data sets (such as temperature fluctuations). It has user interfacing options such giving the user the ability to specify time intervals on the fly, displaying of values when mousing over parts of the chart, and zooming. It also integrates with the Google Visualization API.
http://www.danvk.org/dygraphs/
ExtJs
Ext JS is a cross-browser JavaScript library for building rich internet applications. It now includes charts.
http://www.extjs.com/products/extjs/
FusionCharts
Animated flash charts for web apps. Looks like they work with most technologies.
http://www.fusioncharts.com/Gallery/Default.asp
Google Chart API
The Google Chart API lets you dynamically generate charts.
http://code.google.com/apis/chart/types.html
gRaphaël
gRaphaël is a Javascript library to help you create stunning charts on your website.
http://g.raphaeljs.com/
Highcharts
Highcharts is one of the most promising JavaScript charting libraries to hit the scene recently, with its large array of features including seven charting types (line, pie, and bar among them), the ability to zoom in and out of charts, and tooltips for offering more information about data points.
http://highcharts.com/
iLog Exlixir
Enhance data visualization within Flex and AIR applications with IBM ILOG Elixir.
http://www.ilog.com/products/ilogelixir/demos/
Javascript InfoVis
JavaScript InfoVis, a charting library influenced partly by MooTools, is a robust and excellent solution for data visualization. It’s modular (just like MooTools) so that you can include just the parts you need to keep your pages light. It has animation effects capability to captivate and engage your users, plenty of charting types, a helper class for working with JSON data, and much more.
http://thejit.org/
JFreeChart
Creates charts such as bar charts, line charts, pie charts, time series charts, candlestick charts, high/low/open/close charts, wind plots, and meter charts.
http://www.jfree.org/jfreechart/samples.html
JQuery Plugins
There ar a lot of JQuery chart pugins:
* Visualize by the Filament Group
http://www.filamentgroup.com/lab/jquery_visualize_plugin_accessible_charts_graphs_from_tables_html5_canvas/
* JQChart
http://plugins.jquery.com/project/jQchart
* Flot
http://code.google.com/p/flot/
* Sparklines
http://omnipotent.net/jquery.sparkline/
* TufteGraph
http://xaviershay.github.com/tufte-graph/
* jQuery Google Charts(jGCharts)
http://www.maxb.net/scripts/jgcharts/include/demo/
* jqPlot
http://www.jqplot.com/
JPowered
The PHP graphing scripts provide a very easy way to embed dynamically generated graphs and charts into PHP applications and HTML web pages.
http://www.jpowered.com/
JSCharts
JS Charts is a JavaScript chart generator that requires little or no coding. JS Charts allows you to easily create charts in different templates like bar charts, pie charts or simple line graphs.
http://www.jscharts.com/
JSXGraph
Developed at the University of Bayreuth in Germany, is a standalone JavaScript library for plotting complex geometric shapes and data such as Bezier curves, differential equations, and much more. It has animation features for moving graphs, interactive components such as sliders for experimenting with changing values of variables, and plenty of charting types to choose from.
http://jsxgraph.uni-bayreuth.de/wp/
Kap IT Labs Diagrammer and Visualizer
Kap Lab's Diagrammer provides ready-to-use yet highly customizable multi-layout data visualization and diagramming for Adobe Flex and Air.
http://lab.kapit.fr/display/kaplabhome/Home
MilkChart
A simple to use, yet robust library for transforming table data into a chart. This library uses the HTML5 tag and is only supported on browsers other than IE until ExCanvas gets proper text support.
http://code.google.com/p/milkchart
MooChart
For now, moochart only plots bubble diagrams, but there are plans to expand this MooTools 1.2 plugin to feature pie, line, and bar graphs. The plugin has 14 options that you can use for customizing your diagram’s look, and tooltips for providing more information about a bubble when mousing over them. moochart is open source and released under the MIT license.
http://moochart.coneri.se/
Open Flash Charts
Open source Flash charts.
http://teethgrinder.co.uk/open-flash-chart-2/
PlotKit
PlotKit is a Chart and Graph Plotting Library for Javascript. It has support for HTML Canvas and also SVG via Adobe SVG Viewer and native browser support.
http://www.liquidx.net/plotkit/
ProtoChart
Protochart is a JavaScript library for use with the Prototype JS framework. It uses HTML5’s canvas for modern browsers, and the ExCanvas library for Internet Explorer support. It has six types of charts including line, pie, bars, points, lines with points, and area graphs. It allows for the display of legends that are highly configurable to help identify items on your charts.
http://www.deensoft.com/lab/protochart/index.php
Protovis
Protovis composes custom views of data with simple marks such as bars and dots. Unlike low-level graphics libraries that quickly become tedious for visualization, Protovis defines marks through dynamic properties that encode data, allowing inheritance, scales and layouts to simplify construction.
http://vis.stanford.edu/protovis/
Style Chart
Style Chart is a free JavaScript-based charting web service/API for creating hosted charts. It’s also available as a downloadable library in case you want to host your own charts (though you need to register in order to download it). It has the things you’d expect from a robust and configurable charting library such as tooltips, legends, and 19 types of charts including 3D pie, 3D bar graphs and Pareto charts.
http://chart.inetsoft.com/
Telerik Charts for Silverlight, WFP, ASP.NET
Telerik Charts offers rich functionality and data presentation capabilities.
http://www.telerik.com/
Timline
Timeline is a JavaScript widget for creating interactive timelines. You can scroll through items featured in chronological order by using your mousewheel or by holding down your mouse button on the timeline and dragging left or right. Clicking on a dot, which represents an item in the time line, will reveal more information. Timeline is open source, released under the BSD license
http://www.simile-widgets.org/timeline/
TimePlot
Timeplot allows you to dynamically generate time series graphs. Hovering over data points reveals their value. Timeplot was developed as part of the SIMILE Project at MIT. Here’s a step-by-step tutorial on how to utilize Timeplot. Timeplot is open source and available the BSD license. The Timeplot demo and download links are on this page
http://www.simile-widgets.org/timeplot/
I will be updating when i stumble on any library that is interesting; libraries that can be quickly learnt and used. I will mainly be concentrating on Free libraries. Please do add a comment if you want to recommend anything interesting too.
At this moment I want to thank all the authors/designers who are behind these libraries and have contributed significantly to the data visualization arena.
Ajax.org
Ajax.org Platform is a pure javascript application framework for creating real-time collaborative applications that run in the browser.
http://www.ajax.org/
AnyChart
AnyChart is a flexible Flash based solution that allows you to create interactive and great looking flash charts.
http://www.anychart.com/products/anychart/gallery/
Axiis
Axiis is a Data Visualization Framework for Flex. It has been designed to be a concise, expressive, and modular framework that let developers and designers create compelling data visualization solutions.
http://www.axiis.org/
BirdEye
BirdEye is a community project to advance the design and development of a comprehensive open source information visualization and visual analytics library for Adobe Flex. The actionscript-based library enables users to create multi-dimensional data visualization interfaces for the analysis and presentation of information.
http://birdeye.googlecode.com/svn/branches/ng/examples/demo/BirdEyeExplorer.html
Bluff
Bluff is a lightweight charting library that ports Ruby’s Gruff gem to JavaScript. Weighing at only 11KB gzip’ed (you also need JS.Class which only weighs 2.6KB gzip’ed), it’s surprising that you’ll be able to get 15 different types of charts out of this library. It features tooltips, a ton of configurable options, legend support, and the .set_theme method for declaring reusable themes.
http://bluff.jcoglan.com/
Degrafa
Degrafa is a declarative graphics framework for creating rich user interfaces, data visualization, mapping, graphics editing and more.
http://www.degrafa.org/samples/data-visualization.html
DojoX Data Chart
An addition in the Dojo 1.3 release is the new dojox.charting class. Its primary purpose is to make connecting a chart to a Data Store a simple process.
https://user.sitepen.com/~mwilcox/Chart/DataChart.html
Chronoscope
If you need to visualize thousands or millions of points of data, check this out. Very well designed and can be navigated with the keyboard or mouse. There's a Javascript API, a Google Visualization API or try it as a Google Gadget on Google Spreadsheets, iGoogle, or Open Social.
http://timepedia.org/chronoscope/
Dundas
Dundas has a wide range of data visualization solutions for Microsoft technologies. They offer a number of data visualization tools including: Chart, Gauge, Map and Calendar for .net and Dashboards for Silverlight.
http://www.dundas.com/Components/Gallery/ASP/
Dygraph
dygraphs is a JavaScript library for producing interactive charts for time series data. It was designed to plot dense data sets (such as temperature fluctuations). It has user interfacing options such giving the user the ability to specify time intervals on the fly, displaying of values when mousing over parts of the chart, and zooming. It also integrates with the Google Visualization API.
http://www.danvk.org/dygraphs/
ExtJs
Ext JS is a cross-browser JavaScript library for building rich internet applications. It now includes charts.
http://www.extjs.com/products/extjs/
FusionCharts
Animated flash charts for web apps. Looks like they work with most technologies.
http://www.fusioncharts.com/Gallery/Default.asp
Google Chart API
The Google Chart API lets you dynamically generate charts.
http://code.google.com/apis/chart/types.html
gRaphaël
gRaphaël is a Javascript library to help you create stunning charts on your website.
http://g.raphaeljs.com/
Highcharts
Highcharts is one of the most promising JavaScript charting libraries to hit the scene recently, with its large array of features including seven charting types (line, pie, and bar among them), the ability to zoom in and out of charts, and tooltips for offering more information about data points.
http://highcharts.com/
iLog Exlixir
Enhance data visualization within Flex and AIR applications with IBM ILOG Elixir.
http://www.ilog.com/products/ilogelixir/demos/
Javascript InfoVis
JavaScript InfoVis, a charting library influenced partly by MooTools, is a robust and excellent solution for data visualization. It’s modular (just like MooTools) so that you can include just the parts you need to keep your pages light. It has animation effects capability to captivate and engage your users, plenty of charting types, a helper class for working with JSON data, and much more.
http://thejit.org/
JFreeChart
Creates charts such as bar charts, line charts, pie charts, time series charts, candlestick charts, high/low/open/close charts, wind plots, and meter charts.
http://www.jfree.org/jfreechart/samples.html
JQuery Plugins
There ar a lot of JQuery chart pugins:
* Visualize by the Filament Group
http://www.filamentgroup.com/lab/jquery_visualize_plugin_accessible_charts_graphs_from_tables_html5_canvas/
* JQChart
http://plugins.jquery.com/project/jQchart
* Flot
http://code.google.com/p/flot/
* Sparklines
http://omnipotent.net/jquery.sparkline/
* TufteGraph
http://xaviershay.github.com/tufte-graph/
* jQuery Google Charts(jGCharts)
http://www.maxb.net/scripts/jgcharts/include/demo/
* jqPlot
http://www.jqplot.com/
JPowered
The PHP graphing scripts provide a very easy way to embed dynamically generated graphs and charts into PHP applications and HTML web pages.
http://www.jpowered.com/
JSCharts
JS Charts is a JavaScript chart generator that requires little or no coding. JS Charts allows you to easily create charts in different templates like bar charts, pie charts or simple line graphs.
http://www.jscharts.com/
JSXGraph
Developed at the University of Bayreuth in Germany, is a standalone JavaScript library for plotting complex geometric shapes and data such as Bezier curves, differential equations, and much more. It has animation features for moving graphs, interactive components such as sliders for experimenting with changing values of variables, and plenty of charting types to choose from.
http://jsxgraph.uni-bayreuth.de/wp/
Kap IT Labs Diagrammer and Visualizer
Kap Lab's Diagrammer provides ready-to-use yet highly customizable multi-layout data visualization and diagramming for Adobe Flex and Air.
http://lab.kapit.fr/display/kaplabhome/Home
MilkChart
A simple to use, yet robust library for transforming table data into a chart. This library uses the HTML5 tag and is only supported on browsers other than IE until ExCanvas gets proper text support.
http://code.google.com/p/milkchart
MooChart
For now, moochart only plots bubble diagrams, but there are plans to expand this MooTools 1.2 plugin to feature pie, line, and bar graphs. The plugin has 14 options that you can use for customizing your diagram’s look, and tooltips for providing more information about a bubble when mousing over them. moochart is open source and released under the MIT license.
http://moochart.coneri.se/
Open Flash Charts
Open source Flash charts.
http://teethgrinder.co.uk/open-flash-chart-2/
PlotKit
PlotKit is a Chart and Graph Plotting Library for Javascript. It has support for HTML Canvas and also SVG via Adobe SVG Viewer and native browser support.
http://www.liquidx.net/plotkit/
ProtoChart
Protochart is a JavaScript library for use with the Prototype JS framework. It uses HTML5’s canvas for modern browsers, and the ExCanvas library for Internet Explorer support. It has six types of charts including line, pie, bars, points, lines with points, and area graphs. It allows for the display of legends that are highly configurable to help identify items on your charts.
http://www.deensoft.com/lab/protochart/index.php
Protovis
Protovis composes custom views of data with simple marks such as bars and dots. Unlike low-level graphics libraries that quickly become tedious for visualization, Protovis defines marks through dynamic properties that encode data, allowing inheritance, scales and layouts to simplify construction.
http://vis.stanford.edu/protovis/
Style Chart
Style Chart is a free JavaScript-based charting web service/API for creating hosted charts. It’s also available as a downloadable library in case you want to host your own charts (though you need to register in order to download it). It has the things you’d expect from a robust and configurable charting library such as tooltips, legends, and 19 types of charts including 3D pie, 3D bar graphs and Pareto charts.
http://chart.inetsoft.com/
Telerik Charts for Silverlight, WFP, ASP.NET
Telerik Charts offers rich functionality and data presentation capabilities.
http://www.telerik.com/
Timline
Timeline is a JavaScript widget for creating interactive timelines. You can scroll through items featured in chronological order by using your mousewheel or by holding down your mouse button on the timeline and dragging left or right. Clicking on a dot, which represents an item in the time line, will reveal more information. Timeline is open source, released under the BSD license
http://www.simile-widgets.org/timeline/
TimePlot
Timeplot allows you to dynamically generate time series graphs. Hovering over data points reveals their value. Timeplot was developed as part of the SIMILE Project at MIT. Here’s a step-by-step tutorial on how to utilize Timeplot. Timeplot is open source and available the BSD license. The Timeplot demo and download links are on this page
http://www.simile-widgets.org/timeplot/
December 01, 2010
Data Visualization Fail # 1
The following chart is from Transparency which shows the Corruption Perceptions Index for 2010.
The highlighted blue circles are the regions wherein the color difference is most minimal. I dont think using very minor color gradients in visualization is going to help much in understanding the spread. A first look at the map, demarcates the world in to American(with Oz and North EU) and non-American countries as only Yellow and red are the prominent colors. Regions that are highlighted , using blue circle, do have a variation in the perception index, but to the proximity of the gradient our eye fails to catch them. The best example is probably, South Korea(5.4) and Japan(7.8) - there is indeed a problem here. These two countries fall in two different slabs , and there is a 30% difference in value between them, but on a cursory glance we fail to notice this difference. Similarly, countries within African, European and Asian continents cluster together,
if there is a small country which stands out from the group, then this viz fails to show that.
Remember that color is never seen alone, color is always seen based on what is surrounding it. An effective use of color will group related items and command attention inproportion to importance. Colors are the most neglected and also the most abused factor in any chart. Colors also show the intention of vizualization.
This is a typical case of "Chartjunk due to colors" . One might opine that one can always zoom in and see the difference, but let me show you what happens when i zoom in on Eastern EU.
But, the viz also scores some marks on some other positive aspects:
- An excellant legend (though i would have preferred the words "Very Clean" and "Highly Corrupt" to be placed more closer to the values)
- Displays the countryname/index value on hovering over the country.
- Prescence of a table below the chart which ranks the countries - and this table can be sorted/searched. (the rank information here would have been an icing)
- A multiplication factor of 10 on the Index would have been easy to read ( its easy to read 10-20, 20-30, than 1-2,2-3)
The highlighted blue circles are the regions wherein the color difference is most minimal. I dont think using very minor color gradients in visualization is going to help much in understanding the spread. A first look at the map, demarcates the world in to American(with Oz and North EU) and non-American countries as only Yellow and red are the prominent colors. Regions that are highlighted , using blue circle, do have a variation in the perception index, but to the proximity of the gradient our eye fails to catch them. The best example is probably, South Korea(5.4) and Japan(7.8) - there is indeed a problem here. These two countries fall in two different slabs , and there is a 30% difference in value between them, but on a cursory glance we fail to notice this difference. Similarly, countries within African, European and Asian continents cluster together,
if there is a small country which stands out from the group, then this viz fails to show that.
Remember that color is never seen alone, color is always seen based on what is surrounding it. An effective use of color will group related items and command attention inproportion to importance. Colors are the most neglected and also the most abused factor in any chart. Colors also show the intention of vizualization.
This is a typical case of "Chartjunk due to colors" . One might opine that one can always zoom in and see the difference, but let me show you what happens when i zoom in on Eastern EU.
But, the viz also scores some marks on some other positive aspects:
- An excellant legend (though i would have preferred the words "Very Clean" and "Highly Corrupt" to be placed more closer to the values)
- Displays the countryname/index value on hovering over the country.
- Prescence of a table below the chart which ranks the countries - and this table can be sorted/searched. (the rank information here would have been an icing)
- A multiplication factor of 10 on the Index would have been easy to read ( its easy to read 10-20, 20-30, than 1-2,2-3)
November 19, 2010
Klueless 6
So Klueless 6 is out and I have been breaking my head with it....lost some hair in the due course..
Try : http://www.ahvan.in/ahvan10/klueless6/
Initially, i did not want to give the clues, but there are many who keep searching the Net for possible clues, and some of the levels are just too arbit(which is all the more fun!)...so this post is just for you guys. Here are some clues or hints for cracking the different levels.
Klueless 6 Level 1 Clue : Come on. Cant you just click?
Klueless 6 Level 2 Clue : A coin is always tossed.
Klueless 6 Level 3 Clue : Censored.
Klueless 6 Level 4 Clue : The title was made too easy; if you still dont get it, cant you spot the
region in the map?
Klueless 6 Level 5 Clue : Solve the riddle. But am sure you always work on it.
Klueless 6 Level 6 Clue : You need to cross this level.
Klueless 6 Level 7 Clue : Do what the picture asks you to do. hint 2 Clue : Spot anything?
Klueless 6 Level 8 Clue : Use what is visible.
Klueless 6 Level 9 Clue : If you dont know the mask, you cant proceed. He belongs to?
Klueless 6 Level 10 Clue : Easy one. Use your language skills.
Klueless 6 Level 11 Clue : Source gives you a hint
Klueless 6 Level 12 Clue : I think this is the toughest level. Very good one. No clues, try your luck
and loose your hair.
Klueless 6 Level 13 Clue : You outta know science to solve this.
Klueless 6 Level 14 Clue : Sigh! Go and have a drink now.
Klueless 6 Level 15 Clue : Title gives you a good clue, and yes, you better listen to him.
Klueless 6 Level 16 Clue : Cant you really find the missing ?
Klueless 6 Level 17 Clue : Look Up.
Klueless 6 Level 18 Clue : Counting and multi-coloured tongues.
Klueless 6 Level 19 Clue : Toughie - like 12. You gotta be a CS guy with add-on skills. But dont surrender.
Klueless 6 Level 20 Clue : Am working on this now.
[ I am slightly busy now with reading and other duties and am trying to keep myself away from the Klueless6 addiction for a week; i shall return after a few weeks ]
Try : http://www.ahvan.in/ahvan10/klueless6/
Initially, i did not want to give the clues, but there are many who keep searching the Net for possible clues, and some of the levels are just too arbit(which is all the more fun!)...so this post is just for you guys. Here are some clues or hints for cracking the different levels.
Klueless 6 Level 1 Clue : Come on. Cant you just click?
Klueless 6 Level 2 Clue : A coin is always tossed.
Klueless 6 Level 3 Clue : Censored.
Klueless 6 Level 4 Clue : The title was made too easy; if you still dont get it, cant you spot the
region in the map?
Klueless 6 Level 5 Clue : Solve the riddle. But am sure you always work on it.
Klueless 6 Level 6 Clue : You need to cross this level.
Klueless 6 Level 7 Clue : Do what the picture asks you to do. hint 2 Clue : Spot anything?
Klueless 6 Level 8 Clue : Use what is visible.
Klueless 6 Level 9 Clue : If you dont know the mask, you cant proceed. He belongs to?
Klueless 6 Level 10 Clue : Easy one. Use your language skills.
Klueless 6 Level 11 Clue : Source gives you a hint
Klueless 6 Level 12 Clue : I think this is the toughest level. Very good one. No clues, try your luck
and loose your hair.
Klueless 6 Level 13 Clue : You outta know science to solve this.
Klueless 6 Level 14 Clue : Sigh! Go and have a drink now.
Klueless 6 Level 15 Clue : Title gives you a good clue, and yes, you better listen to him.
Klueless 6 Level 16 Clue : Cant you really find the missing ?
Klueless 6 Level 17 Clue : Look Up.
Klueless 6 Level 18 Clue : Counting and multi-coloured tongues.
Klueless 6 Level 19 Clue : Toughie - like 12. You gotta be a CS guy with add-on skills. But dont surrender.
Klueless 6 Level 20 Clue : Am working on this now.
[ I am slightly busy now with reading and other duties and am trying to keep myself away from the Klueless6 addiction for a week; i shall return after a few weeks ]
January 02, 2010
Year End Jaunts - Kutch
[Work in progress - some more verbiage will be included]
Day 1 - Monday - 28th December, 2009
- Reach Nasik in the moring
- Visit Triambekshwar


- Go on to Daman via Vapi. Watch Sunset at Daman


- Back to Vapi and then onto Vadodara
Day 2 - Tuesday - 29th December, 2009
- Vadodara to Pavagadh
- Ropeway and then onto Champaner Kali temple

- Back to Vadodara and then onto Ahemedabad
- Ahmedabad to Bhuj
Day 3 - Wednesday - 30th December, 2009
- Reach Bhuj and then onto Mandvi
- Check in hotel at Mandvi early morning.
- Get up at 8. Walk along the beach from 9-12:30. Then Vijay Vilas palace.


- Evening walk in the shipmaking yard

- and then some street foood and good sleep.
Day 4 - Thusday - 31st December, 2009
- Get up early morning. Move to Bhuj
- Parag and Aina Mahal

- Bhujodi - visit some weavers and see their crafts
- Then onto Ahmedabad via Anjar and Gandhidham

Day 5 - Friday - 1st January, 2010
- Spend overnight at Ahmedabad Airport and catch the early morning flight to Bangalore. Reach Blore by 12pm.

Expenses:
Pune to Nasik(Volvo) = 250
Nasik to Vapi = 90
Vapi to Daman = 10
Daman to Vapi = 10
Vapi to Vadodara = 141
Vadodara to Pavagadh = 30
Pavagadh to Ahm = 80
Ahm to Bhuj = 151
BHuj to Mandvi =
Mandvi to Bhuj = 30
Bhuj to BHujodi = 5
Bhujodi to Anjar(Pvt bus) = 20
Anjar to Gandhidham = 15
Gandhidham to Ahm = 134
Ahm ST Bus stand to Airport(Auto) = 100
Ahm-Blr Spicejet(Air) = 5129
Blr Airport to Home = 100
Room at Mandvi = 450
Food Expenses = 500
Total = 450 + 1166 + 5129 + 500 + 200 = 7500
Day 1 - Monday - 28th December, 2009
- Reach Nasik in the moring
- Visit Triambekshwar
- Go on to Daman via Vapi. Watch Sunset at Daman
- Back to Vapi and then onto Vadodara
Day 2 - Tuesday - 29th December, 2009
- Vadodara to Pavagadh
- Ropeway and then onto Champaner Kali temple
- Back to Vadodara and then onto Ahemedabad
- Ahmedabad to Bhuj
Day 3 - Wednesday - 30th December, 2009
- Reach Bhuj and then onto Mandvi
- Check in hotel at Mandvi early morning.
- Get up at 8. Walk along the beach from 9-12:30. Then Vijay Vilas palace.
- Evening walk in the shipmaking yard
- and then some street foood and good sleep.
Day 4 - Thusday - 31st December, 2009
- Get up early morning. Move to Bhuj
- Parag and Aina Mahal
- Bhujodi - visit some weavers and see their crafts
- Then onto Ahmedabad via Anjar and Gandhidham
Day 5 - Friday - 1st January, 2010
- Spend overnight at Ahmedabad Airport and catch the early morning flight to Bangalore. Reach Blore by 12pm.
Expenses:
Pune to Nasik(Volvo) = 250
Nasik to Vapi = 90
Vapi to Daman = 10
Daman to Vapi = 10
Vapi to Vadodara = 141
Vadodara to Pavagadh = 30
Pavagadh to Ahm = 80
Ahm to Bhuj = 151
BHuj to Mandvi =
Mandvi to Bhuj = 30
Bhuj to BHujodi = 5
Bhujodi to Anjar(Pvt bus) = 20
Anjar to Gandhidham = 15
Gandhidham to Ahm = 134
Ahm ST Bus stand to Airport(Auto) = 100
Ahm-Blr Spicejet(Air) = 5129
Blr Airport to Home = 100
Room at Mandvi = 450
Food Expenses = 500
Total = 450 + 1166 + 5129 + 500 + 200 = 7500
December 14, 2009
Whats Brewing
Thinking of doing Bangalore to Delhi , by road, in 10 days. Solo.
Pit Stops : Mumbai, Aurangabad, Nashik, Daman, Udaipur, Barmer, Jaisalmer, Pokhran, Bikaner, Jaipur, New Delhi.
Budget : 10,000 INR (includes Delhi-Blr flight)
Mode of Transport : Mainly buses; Hitchhike wherever possible.
Possible changes to the plan :
1. Stop at Ahmadabad and instead go exploring Gujarat
2. Explore Maharastra and Madhya Pradesh.
3. Get wasted in some virgin beaches along the Western Coast
Pit Stops : Mumbai, Aurangabad, Nashik, Daman, Udaipur, Barmer, Jaisalmer, Pokhran, Bikaner, Jaipur, New Delhi.
Budget : 10,000 INR (includes Delhi-Blr flight)
Mode of Transport : Mainly buses; Hitchhike wherever possible.
Possible changes to the plan :
1. Stop at Ahmadabad and instead go exploring Gujarat
2. Explore Maharastra and Madhya Pradesh.
3. Get wasted in some virgin beaches along the Western Coast
December 11, 2009
Read and To-Be Read
2009 was the year when i read the maximum number of books in a year - probably, more than when i was in college. Books coupled with a hectic schedule at work, loads of movies and some occasional travels/treks kept me occupied for bulk of the time. The worst hit was my feed reader, which has tonnes to be read.
#1. "The Wind-Up Bird Chronicle" by Haruki Murakami
2. "The Curious Incident of the Dog in the Night Time" by Mark Haddon
#3. "Hard-boiled Wonderloand and the End of the World" by Haruki Murakami
#4. "Blind Willow , Sleeping Woman" by Haruki Murakami
#5. "Dance Dance Dance" by Haruki Murakami
*6. "Heart of Darkness" by Joseph Conrad
#7. "The Calculus Wars - Newton,Leibniz & the Greatest Mathematical clash of All Time" by Jason Bardi
8. "The Mind's I: Fantasies and Reflections on Self & Soul" by Douglas R. Hofstadter, Daniel C. Dennett, and Daniel C. Dennett
*9. "My Uncle Oswald" by Roald Dahl
*10. "The Stranger" by Albert Camus
#11. "The Eye of the Needle" by Ken Follet
*12. "Darkness Visible: A Memoir of Madness" by William Styron
13. "Watchmen" by Alan Moore
14. "Surely You're Joking Mr.Feynman!" by Richard P.Feynman.
#15. "The Fermata" by Nicholson Baker
#16. "Disney War" by James B. Stewart
#17. "McMafia - A Journey through the Global Underworld" by Misha Glenny
#18. "Warlock" by Wilbur Smith
19. "How the Universe Got Its Spots: Diary of a Finite Time in a Finite Space" by Janna Levin
#20. "Men of Tomorrow: Geeks, Gangsters, and the Birth of the Comic Book" by Gerard Jones
#21. "The Swiss Account" by Paul Erdman.
#22. "Den of Thieves" by James B.Stewart
My wish list for the year 2010(below) is more ambitious and i hope that i would be able to complete them. Bulk of them are not available in the Indian markets and if available are priced exhorbitantly. So, if you happen to be in Chennai/Bangalore , then I would like to swap some books.
And also, by the way, i whole heartedly accept gifts :)
1. "Vurt" by Jeff Noon
* 2. "Norwegian Wood" by Haruki Murakami
* 3. "Sputnik Sweetheart" by Haruki Murakami
* 4. "Kafka On the Shore" by Haruki Murakami
* 5. "After Dark" by Haruki Murakami
* 6. "Pinball 1973" by Haruki Murakami
7. "Blue Octavo Notebooks" by Franz Kafka
8. "The Trial" by Franz Kafka
9. "Collected Stories" by Franz Kafka
#10. "Promise and Power: The Life and Times of Robert McNamara" by Deborah Shapley
#11. "The Age of Turbulence: Adventures in a New World" by Alan Greenspan
*12. "Charlie and the Chocolate Factory" by Roald Dahl
*13. "Charlie and the Great Glass Elevator" by Roald Dahl
#14. "The Fourth Protocol" BY Fredrick Forsyth
*15. "In Search of the Miraculous" by P.D.Ouspensky
*16. "Darkness at Noon" by Arthur Koestler
17. "Invitation to a Beheading" by Vladimir Nabokov
18. "Man and His Symbols" by Carl Gustav Jung
19. "Man Who Mistook His Wife for a Hat" by Oliver Sacks
20. "Satan Burger" by Carlton Mellick III
21. "The Sack of Rome: How a Beautiful European Country with a Fabled History and a Storied Culture Was Taken Over by a Man Named Silvio Berlusconi" by Alexander Stille
22. "Gomorrah: A Personal Journey into the Violent International Empire of Naple's Organized Crime System" by Roberto Saviano
23. "The Pursemonger of Fugu: A Bathroom Mystery" by Greg Kramer
24. "The Brothers Karamazov" by Feodor Dostoevsky
#25. "On wings of Eagles" by Ken Follet
#26. "Man from St.Petersburg" by Ken Follet
#27. "Every Man a Speculator: A History of Wall Street in American Life" by Steve Fraser
28. "Night" by A. Alvarez
#29. "Gates to Alamo" by Stephen Harrigan
*30. "The Gulag Archipelago - An Experiment in Literary Investigation" by Solzhenitsyn
#31. "Cryptominicon" by Neal Stephenson
#32. "How the Mind Works" by Steven Pinker
*33. "Food of the Gods" by Terence McKenna
34. "Microserfs" by Douglas Coupland
*36. "Fateful Triangle - The United States, Israel, and the Palestinians" by Noam Chomsky
The starred ones(*) above are eBooks. Though i hate to read books in my computer, but given the unavailability of the books in the Indian markets and also the high prices, reading it online is not a bad proposition.
The hashed(#) books are the ones that i already have as hard copies.
#1. "The Wind-Up Bird Chronicle" by Haruki Murakami
2. "The Curious Incident of the Dog in the Night Time" by Mark Haddon
#3. "Hard-boiled Wonderloand and the End of the World" by Haruki Murakami
#4. "Blind Willow , Sleeping Woman" by Haruki Murakami
#5. "Dance Dance Dance" by Haruki Murakami
*6. "Heart of Darkness" by Joseph Conrad
#7. "The Calculus Wars - Newton,Leibniz & the Greatest Mathematical clash of All Time" by Jason Bardi
8. "The Mind's I: Fantasies and Reflections on Self & Soul" by Douglas R. Hofstadter, Daniel C. Dennett, and Daniel C. Dennett
*9. "My Uncle Oswald" by Roald Dahl
*10. "The Stranger" by Albert Camus
#11. "The Eye of the Needle" by Ken Follet
*12. "Darkness Visible: A Memoir of Madness" by William Styron
13. "Watchmen" by Alan Moore
14. "Surely You're Joking Mr.Feynman!" by Richard P.Feynman.
#15. "The Fermata" by Nicholson Baker
#16. "Disney War" by James B. Stewart
#17. "McMafia - A Journey through the Global Underworld" by Misha Glenny
#18. "Warlock" by Wilbur Smith
19. "How the Universe Got Its Spots: Diary of a Finite Time in a Finite Space" by Janna Levin
#20. "Men of Tomorrow: Geeks, Gangsters, and the Birth of the Comic Book" by Gerard Jones
#21. "The Swiss Account" by Paul Erdman.
#22. "Den of Thieves" by James B.Stewart
My wish list for the year 2010(below) is more ambitious and i hope that i would be able to complete them. Bulk of them are not available in the Indian markets and if available are priced exhorbitantly. So, if you happen to be in Chennai/Bangalore , then I would like to swap some books.
And also, by the way, i whole heartedly accept gifts :)
1. "Vurt" by Jeff Noon
* 2. "Norwegian Wood" by Haruki Murakami
* 3. "Sputnik Sweetheart" by Haruki Murakami
* 4. "Kafka On the Shore" by Haruki Murakami
* 5. "After Dark" by Haruki Murakami
* 6. "Pinball 1973" by Haruki Murakami
7. "Blue Octavo Notebooks" by Franz Kafka
8. "The Trial" by Franz Kafka
9. "Collected Stories" by Franz Kafka
#10. "Promise and Power: The Life and Times of Robert McNamara" by Deborah Shapley
#11. "The Age of Turbulence: Adventures in a New World" by Alan Greenspan
*12. "Charlie and the Chocolate Factory" by Roald Dahl
*13. "Charlie and the Great Glass Elevator" by Roald Dahl
#14. "The Fourth Protocol" BY Fredrick Forsyth
*15. "In Search of the Miraculous" by P.D.Ouspensky
*16. "Darkness at Noon" by Arthur Koestler
17. "Invitation to a Beheading" by Vladimir Nabokov
18. "Man and His Symbols" by Carl Gustav Jung
19. "Man Who Mistook His Wife for a Hat" by Oliver Sacks
20. "Satan Burger" by Carlton Mellick III
21. "The Sack of Rome: How a Beautiful European Country with a Fabled History and a Storied Culture Was Taken Over by a Man Named Silvio Berlusconi" by Alexander Stille
22. "Gomorrah: A Personal Journey into the Violent International Empire of Naple's Organized Crime System" by Roberto Saviano
23. "The Pursemonger of Fugu: A Bathroom Mystery" by Greg Kramer
24. "The Brothers Karamazov" by Feodor Dostoevsky
#25. "On wings of Eagles" by Ken Follet
#26. "Man from St.Petersburg" by Ken Follet
#27. "Every Man a Speculator: A History of Wall Street in American Life" by Steve Fraser
28. "Night" by A. Alvarez
#29. "Gates to Alamo" by Stephen Harrigan
*30. "The Gulag Archipelago - An Experiment in Literary Investigation" by Solzhenitsyn
#31. "Cryptominicon" by Neal Stephenson
#32. "How the Mind Works" by Steven Pinker
*33. "Food of the Gods" by Terence McKenna
34. "Microserfs" by Douglas Coupland
*36. "Fateful Triangle - The United States, Israel, and the Palestinians" by Noam Chomsky
The starred ones(*) above are eBooks. Though i hate to read books in my computer, but given the unavailability of the books in the Indian markets and also the high prices, reading it online is not a bad proposition.
The hashed(#) books are the ones that i already have as hard copies.
November 29, 2009
Hair Raising Love Story
Prelude
Myself and Shree Kumar went on the search for a trail a few weeks back in the Western Ghats. The idea was to find out a trail which connects Kukke to Madikeri(also called Mercara, in the Coorg district) - a straight line distance of around 35Kms through some mountains, jungles and villages .Buses do a round trip of 100kms instead. Our idea was to cut across these and reach Madikeri. Though i can go on and on about what happened, and how we abandoned this trail and went on in search of a 97m waterfall and the gory details of the leech attack etc etc, but i will reserve that for latter.
Instead ...read on.
Chapter - 1
We were cutting across a dense jungle, with some thorny bushes and creepers. We were lost and were trying to get back to a trail that we had used before so that we could get back on track and pursue things from thereon. It was then that something screeched my arm and caused an intense pain. I thought that it was some thorny bush that managed to scrape through my skin and hence the pain. I removed the creeper from my skin and also removed the small fern like thorns that were stuck on my jacket. 2 mins later, backside of my palm started itching intensely. The skin had turned pink; i tried not to itch it but it was so intense that i could not stop rubbing it. Shree was a few steps in front of me. I told him that something was itching and he better be careful with the bushes. He suspected a 'kamblipoochi' (millipede with the carpet cover which causes itch - it is found on drumstick trees).
It was then that i saw something really wierd happen. The miniscule hair on my fingers froze and stood erect, as if, it was inserted in liquid nitrogen; i also saw it increase in length.Am not sure whether it actually increased in length or was it an optical illusion caused due to the hair being erect. Well,how many times have we taken cognizance of the hair on the fingers. When i rubbed them, they just fell off. It was exactly like a banana breaking after it was inserted in Liquid Nitrogen! I just kept looking at it; am not sure whether i was looking at another optical illusion but i saw the hair grow from those areas again quickly. It was like those small samplings grow in a fast forwarded film which captures the birth and growth of a plant from a seed. I got terrified (and excited) and was yelling at Shree about this. I connected this with 'My Uncle Oswald' and the correlation with the dried Sudanese blister beetle ; and how ESI erectile dysfunction syndrome and baldness were two multi billion markets. In a matter of seconds, i had pictured myself sitting on top of a mountain of currency notes and be the empire in a market that was driven by hoax pills and unwanted surgeries. A fresh piece of life to all those bald heads and how they could now be irrigated and made into lush new fields. All those women who were bored with bald heads could not get a respite (not to mention that some women 'still' preferred bald heads :P ).
All excited, I screamed, called Shree to show him what was happening and offered him a proverbial 'partner' position in my new-yet-to-launch business empire. Shree came over and inspected. He didnt believe me first. I did not want to give him a demo for i was afraid that i might not follow the 'right procedures'. But i took my chances and decided that I will do a demo and lure him into this business proposition.
A standing ground amongst the bushes was chosen and i showed the backside of my palm to him. I asked him to look at those fingers and concentrate on the hair there. The skin was pale red. I told him that the redness was probably some side effect of the 'growth'. The hair was erect. As a deft demo'er i told him the sequence of steps that i would be doing and what he can expect out of it. I brushed my right arm quickly against my jeans to remove any unsolicted germs which could effect the 'area'; brought it over and reiterated the steps to him. I was all excited and so was he, though he did not still believe it.
I rubbed my right arm over the hair so that they could fall. They didnt. It stoood steadfast. Probably i did not apply the requisite pressure. I again rubbed it hard. The hairs were all standing as if they were the last survivig poles in an armageddon movie. Shree mocked and kept on walking. I stood there. I could not believe it. I took a few steps and again stopped. I again called Shree and told him that i would pluck the hair. I did. Now they came off. I asked him to wait and watch. We waitied for 15seconds. Nothing happened. I waited. I was counting one to ten at the back of my head. The thoughts of being the next Reliance or the next IBM was still hanging around. Shree kept on walking. I told him that probably we could wait for a few minutes more and see what happens. I again inspected the fingers at five minute regular intervals. Nothing was happening. And thus it all got over. All my thoughts/ideas of a new business empire lasted only for a few minutes. It all got washed down the toilet with a gentle press of the flush. And i soon forgot about all this hair raising incident.
Chapter 2
Shree and me were trekking together for the first time. We had known each other for a few years now and used to chat a lot online, but this was the second time that we met.Treks and travels are the best times when one discovers a person's true identity/character. Also, one gets to hear many stories and incidents which are nice to hear. Experiences are shared and some forgotten memories retold.
I have never been fascinated by love stories. The only love story that truly inspires me is the Story of the Taj Mahal. I think most teens get into this 'love' mode not exactly understanding the nuances of it. I would not generalize it by calling 'all love stories are farce'. But from what i understand, i think it takes some level of maturity to understand the larger aspects of life and how the spouse is important in the journey; infatuation is transitory. Without getting into rhetoric, i would summarize it by saying that 'One needs a reason to live and if the spouse is that reason, then there is no greater joy'.
Shree's pal was in the Indian Army and was in the Kargil War. His truck exploded due to an IED(Improvised Explosive Device) ; he flew into the air 200mts away and his truck blown into pieces. Luckily he survived, but he was immobile and lost sensation in the lower half of the body. His spine was badly injured. He was treated in the hospital for a few years wherein he was in coma. When Shree went to visit him , he saw that his pal's arm was badly atrophied. What used to be the arm of a armyman was now meek, slender and barely a few centimeters thick. Shree could not believe his eyes.
I asked him whether his pal was married. Shree replied that 'now he is'. I did not understand it. He was not married before the war, but apparently he is now. He married a nurse in the hospital wherein he was treated.
If a lady decides to 'commit' her life for someone who is not-functional for the rest of his life, and is not repentant about it, is a lady of true virtue and wisdom.
My eyes were wet. My mind numbed.
Good Bye
Shree was snoring next to me in the bus back to Bangalore. I was thinking about these two incidents, looked at the backside of my palm and smiling at the sequence of events.
Simple things in life are the most joyful, always. Life is beautiful.
Myself and Shree Kumar went on the search for a trail a few weeks back in the Western Ghats. The idea was to find out a trail which connects Kukke to Madikeri(also called Mercara, in the Coorg district) - a straight line distance of around 35Kms through some mountains, jungles and villages .Buses do a round trip of 100kms instead. Our idea was to cut across these and reach Madikeri. Though i can go on and on about what happened, and how we abandoned this trail and went on in search of a 97m waterfall and the gory details of the leech attack etc etc, but i will reserve that for latter.
Instead ...read on.
Chapter - 1
We were cutting across a dense jungle, with some thorny bushes and creepers. We were lost and were trying to get back to a trail that we had used before so that we could get back on track and pursue things from thereon. It was then that something screeched my arm and caused an intense pain. I thought that it was some thorny bush that managed to scrape through my skin and hence the pain. I removed the creeper from my skin and also removed the small fern like thorns that were stuck on my jacket. 2 mins later, backside of my palm started itching intensely. The skin had turned pink; i tried not to itch it but it was so intense that i could not stop rubbing it. Shree was a few steps in front of me. I told him that something was itching and he better be careful with the bushes. He suspected a 'kamblipoochi' (millipede with the carpet cover which causes itch - it is found on drumstick trees).
It was then that i saw something really wierd happen. The miniscule hair on my fingers froze and stood erect, as if, it was inserted in liquid nitrogen; i also saw it increase in length.Am not sure whether it actually increased in length or was it an optical illusion caused due to the hair being erect. Well,how many times have we taken cognizance of the hair on the fingers. When i rubbed them, they just fell off. It was exactly like a banana breaking after it was inserted in Liquid Nitrogen! I just kept looking at it; am not sure whether i was looking at another optical illusion but i saw the hair grow from those areas again quickly. It was like those small samplings grow in a fast forwarded film which captures the birth and growth of a plant from a seed. I got terrified (and excited) and was yelling at Shree about this. I connected this with 'My Uncle Oswald' and the correlation with the dried Sudanese blister beetle ; and how ESI erectile dysfunction syndrome and baldness were two multi billion markets. In a matter of seconds, i had pictured myself sitting on top of a mountain of currency notes and be the empire in a market that was driven by hoax pills and unwanted surgeries. A fresh piece of life to all those bald heads and how they could now be irrigated and made into lush new fields. All those women who were bored with bald heads could not get a respite (not to mention that some women 'still' preferred bald heads :P ).
All excited, I screamed, called Shree to show him what was happening and offered him a proverbial 'partner' position in my new-yet-to-launch business empire. Shree came over and inspected. He didnt believe me first. I did not want to give him a demo for i was afraid that i might not follow the 'right procedures'. But i took my chances and decided that I will do a demo and lure him into this business proposition.
A standing ground amongst the bushes was chosen and i showed the backside of my palm to him. I asked him to look at those fingers and concentrate on the hair there. The skin was pale red. I told him that the redness was probably some side effect of the 'growth'. The hair was erect. As a deft demo'er i told him the sequence of steps that i would be doing and what he can expect out of it. I brushed my right arm quickly against my jeans to remove any unsolicted germs which could effect the 'area'; brought it over and reiterated the steps to him. I was all excited and so was he, though he did not still believe it.
I rubbed my right arm over the hair so that they could fall. They didnt. It stoood steadfast. Probably i did not apply the requisite pressure. I again rubbed it hard. The hairs were all standing as if they were the last survivig poles in an armageddon movie. Shree mocked and kept on walking. I stood there. I could not believe it. I took a few steps and again stopped. I again called Shree and told him that i would pluck the hair. I did. Now they came off. I asked him to wait and watch. We waitied for 15seconds. Nothing happened. I waited. I was counting one to ten at the back of my head. The thoughts of being the next Reliance or the next IBM was still hanging around. Shree kept on walking. I told him that probably we could wait for a few minutes more and see what happens. I again inspected the fingers at five minute regular intervals. Nothing was happening. And thus it all got over. All my thoughts/ideas of a new business empire lasted only for a few minutes. It all got washed down the toilet with a gentle press of the flush. And i soon forgot about all this hair raising incident.
Chapter 2
Shree and me were trekking together for the first time. We had known each other for a few years now and used to chat a lot online, but this was the second time that we met.Treks and travels are the best times when one discovers a person's true identity/character. Also, one gets to hear many stories and incidents which are nice to hear. Experiences are shared and some forgotten memories retold.
I have never been fascinated by love stories. The only love story that truly inspires me is the Story of the Taj Mahal. I think most teens get into this 'love' mode not exactly understanding the nuances of it. I would not generalize it by calling 'all love stories are farce'. But from what i understand, i think it takes some level of maturity to understand the larger aspects of life and how the spouse is important in the journey; infatuation is transitory. Without getting into rhetoric, i would summarize it by saying that 'One needs a reason to live and if the spouse is that reason, then there is no greater joy'.
Shree's pal was in the Indian Army and was in the Kargil War. His truck exploded due to an IED(Improvised Explosive Device) ; he flew into the air 200mts away and his truck blown into pieces. Luckily he survived, but he was immobile and lost sensation in the lower half of the body. His spine was badly injured. He was treated in the hospital for a few years wherein he was in coma. When Shree went to visit him , he saw that his pal's arm was badly atrophied. What used to be the arm of a armyman was now meek, slender and barely a few centimeters thick. Shree could not believe his eyes.
I asked him whether his pal was married. Shree replied that 'now he is'. I did not understand it. He was not married before the war, but apparently he is now. He married a nurse in the hospital wherein he was treated.
If a lady decides to 'commit' her life for someone who is not-functional for the rest of his life, and is not repentant about it, is a lady of true virtue and wisdom.
My eyes were wet. My mind numbed.
Good Bye
Shree was snoring next to me in the bus back to Bangalore. I was thinking about these two incidents, looked at the backside of my palm and smiling at the sequence of events.
Simple things in life are the most joyful, always. Life is beautiful.
July 23, 2009
The Andhra Land
Andhra Pradesh is the rice bowl of India. The eastern parts of the state are filled with paddy fields and the western regions are mostly dry. As a kid, when i was in Orissa/Assam , we used to travel by trains(the usual Coromandel/Howrah express or the Trivandram-Guwahati Express), almost ONE complete day used to pass by this HUGE state. Not to forget the steaming masala dosas, vadas and idlis at the Rajamundri railway station and nice mangoes at Vizag and Vijayawada.
I have not heard of many who have traveled much in A.P or have visited A.P for leisure; and those have visited have gone only to Tirupathi or Ahobilam. And that led me to check out this bland but yet interesting state.
Did 2 excursions of the state (all in 'dabba' bus) :
Tour 1 (Feb'07) :
Kurnool was the base and roamed around. Budget : 3k INR
Day 1 : Bangalore - Hindupur - Lepakshi - Hindupur - Anantpur - Kurnool
---- Ruins and paintings at the beautiful Lepakshi temple, and the big nandi.
Day 2 : Kurnool - Banganapalli - Belum Caves - Nandyal - Mahanandi - Nandyal - Kurnool
---- Belum Caves is the second largest underground cave system
---- Mahanandi boasts of a temple which has a pool wherein water is so clear that you can spot a pin at its bottom
Day 3 : Kurnool - Yemmiganur - Mantralayam - Kurnool - Alampura Chowraste - Alampura - Kurnool - Bangalore
---- Raghavendra Temple at Mantralayam
---- Alampura ruins
Tour 2 (Jan'08) :
Budget : 2k INR
Day 1 : Vijayawada (KanakaDurga temple, Undavalli and Mogalarajapuram caves, Kondapalli)
Day 2 : Vishakapatnam (Simhachalam temple) et al.
Day 3 : Araku - Borra Caves
Day 4 : Bhadrachalam (Ram temple) - Warangal(Temple and Fort ruins)
Other place of obvious interest are : Hyderabad, Ahobilam, Srisailam (the latter 2 being important temples)
Couple of pointers w.r.t travel in A.P:
# Very Dry and HOT - STRICTLY avoid summer months.
# Temples and ruins are more than greenery
# Good connectivity by buses (no worries on this front)
# Not frequented by many tourists
# Cheap
My personal faves in A.P would be :
# Lepakshi
# Belum Caves
# Alampura ruins
# Spine numbing ride to Belum caves via the dry Cuddapah fields (take the small 'dabba' bus and enjoy with the locals)
# Early morning sunrise from KanakaDurga temple overlooking the Krishna river.
Pictures:
http://picasaweb.google.com/venkat83/NorthernAndhraPradesh
http://picasaweb.google.com/venkat83/Alampura
http://picasaweb.google.com/venkat83/Mahanandi
http://picasaweb.google.com/venkat83/BelumCaves
http://picasaweb.google.com/venkat83/Lepakshi
Hope this was helpful if you are planning a trip to the Andhra land.
I have not heard of many who have traveled much in A.P or have visited A.P for leisure; and those have visited have gone only to Tirupathi or Ahobilam. And that led me to check out this bland but yet interesting state.
Did 2 excursions of the state (all in 'dabba' bus) :
Tour 1 (Feb'07) :
Kurnool was the base and roamed around. Budget : 3k INR
Day 1 : Bangalore - Hindupur - Lepakshi - Hindupur - Anantpur - Kurnool
---- Ruins and paintings at the beautiful Lepakshi temple, and the big nandi.
Day 2 : Kurnool - Banganapalli - Belum Caves - Nandyal - Mahanandi - Nandyal - Kurnool
---- Belum Caves is the second largest underground cave system
---- Mahanandi boasts of a temple which has a pool wherein water is so clear that you can spot a pin at its bottom
Day 3 : Kurnool - Yemmiganur - Mantralayam - Kurnool - Alampura Chowraste - Alampura - Kurnool - Bangalore
---- Raghavendra Temple at Mantralayam
---- Alampura ruins
Tour 2 (Jan'08) :
Budget : 2k INR
Day 1 : Vijayawada (KanakaDurga temple, Undavalli and Mogalarajapuram caves, Kondapalli)
Day 2 : Vishakapatnam (Simhachalam temple) et al.
Day 3 : Araku - Borra Caves
Day 4 : Bhadrachalam (Ram temple) - Warangal(Temple and Fort ruins)
Other place of obvious interest are : Hyderabad, Ahobilam, Srisailam (the latter 2 being important temples)
Couple of pointers w.r.t travel in A.P:
# Very Dry and HOT - STRICTLY avoid summer months.
# Temples and ruins are more than greenery
# Good connectivity by buses (no worries on this front)
# Not frequented by many tourists
# Cheap
My personal faves in A.P would be :
# Lepakshi
# Belum Caves
# Alampura ruins
# Spine numbing ride to Belum caves via the dry Cuddapah fields (take the small 'dabba' bus and enjoy with the locals)
# Early morning sunrise from KanakaDurga temple overlooking the Krishna river.
Pictures:
http://picasaweb.google.com/venkat83/NorthernAndhraPradesh
http://picasaweb.google.com/venkat83/Alampura
http://picasaweb.google.com/venkat83/Mahanandi
http://picasaweb.google.com/venkat83/BelumCaves
http://picasaweb.google.com/venkat83/Lepakshi
Hope this was helpful if you are planning a trip to the Andhra land.
July 17, 2009
Road Trip - Jammu to Delhi via Drass, Leh and Manali
So this is what it was :
[Day 1] July 3th, 2009 : Blore to Delhi and then onto Jammu
Started from Bangalore at noon. JetLite flight to Delhi. Hopeless airhostesses. Reach ISBT by 5pm. Board a super 'dabba' bus to Jammu at 7pm. Amazing chat with a jawan who was in Siachen and who had also fought in the Kargil war. Nice chats with other fellow passengers. Didnt sleep much.
[Day 2] July 4th, 2009 : Roam around in Jammu
Reach Jammu at 10am. Hot and dusty Jammu. Took a room and a quick nap. Stroll in the bazaar in the evening.
[Day 3] July 5th, 2009 : Jammu Sight Seeing
Parents arrived early morning by train. Received them in the railway station and then to the hotel. Went sight seeing in the hot sun. Visited some temples and some more temples.
[Day 4] July 6th, 2009 : Visit to Vaishno Devi
Early morning depart for Katra. Reach Sanjheechat by helicopter. Walk for 2 km to the actual cave(bhawan). Back to Sanjheechat from Bhawan by walk and then to Katra by helicopter. Back to Jammu in the evening. Parents happy :)
[Day 5] July 7th, 2009 : Rest Day. Jammu to Srinagar
Damn HOT day. Day spent in the hotel , talking and eating and sleeping. Left parents in the railway station in the evening at 5pm.
I came back to bus stand and then after some hassles got a shared cab to Srinagar. An amazing ride . Nice fellow passengers. They told me a lot about Kashmir - climate, issues, food and water. Who were VERY nice to me. Was thrilled and excited . Night halt in the cab in front of Jawahar Tunnel, as it was closed.
[Day 6] July 8th, 2009 : Kashmir Valley, Sonemarg and Drass
Start from Jawahar Tunnel at around 7:30 am in the same cab and then reach Srinagar at 10am. View as soon as one emerges out of the tunnel was mind numbing. Amazingly beautiful. Came to know that all buses to Drass/Kargil/Leh have departed already in the morning and there was no means now :( Luckily, got informed by a guy there that there was a bus that was going to Sonemarg to pick people back to Srinagar; from Srinagar i can hitchike to Drass/Kargil.
Hopped into this bus; nice landscapes enroute. Reached Sonemarg around 1pm and then got into a truck that was going to Leh. Was stopped at Zoji Pass by the Army. Got stuck. Luckily got a school bus and the army jawan asked me to go to Drass in that. Thanked the jawan. Had the ride of the lifetime with the kids in the school bus. Singing and clicking. Reached Drass at 8pm - sun still to set. Couldnt sleep much in the night.
[Day 7] July 9th, 2009 : Kargil and Leh
Woke up early at 4:30am and went for a stroll. View of Tiger Hills was amazing. Came back to room, packed and kept walking. Took a cab which was going to Kargil. An 'intellectual' ride to Kargil from Drass. The scenary was captivating. Reached Kargil by 9:30am. Walked around 5-6kms till outskirts of Kargil to catch a truck to reach Leh. Got one. Stopped in the middle for break. Got a cab from nowhere and then a beautiful, challenging and dangerous ride to Leh. Reached Leh in the evening. Took a dormitory. Roamed around in the bazaar in the night and then retired for the day.
[Day 8] July 10th, 2009 : Leh to Keylong
Start early from Leh at 6am. Via dusty roads and snow capped mountains and snow fields. Slow and jerky ride in the bus. Reached Keylong at 9am. Night halt in a dormitory.
[Day 9] July 11th, 2009 : To Delhi - Keylong to Manali and then to Chandigarh
Bus ride with school kids singing. Uneventful ride to Manali via Rohtang Pass. Petrol smoke fills the air near Rohtang. Temperature raises after Manali. Gets hot by the evening when we reach Bilaspur then 'really' hot as we reached Chandigarh in the night.
[Day 10] July 12th, 2009 : Delhi
Reached Delhi at 5am. REALLY hot and humid. A much needed bath after 4 days. Day spent sleeping in the hotel. A long stroll and some street food in Paharganj in the evening. Sweat!
[Day 11] July 13th, 2009 : Back to Banglaore
JetLite flight from Delhi to Bangalore early morning. Hopless cabin crew. Fly. Back home.
Expenses:
Commute : 6035
- Flight to-fro Bangalore-Delhi 3740
- Volvo to-fro Blore airport (125*2=) 250
- Delhi to Jammu(Haryana.T.D.C Bus) 325
- Jammu to Srinagar (Shared cab) 350
- Srinagar to Sonemarg (J.K.S.T.D.C bus) 170
- Drass to Kargil (Shared cab) 70
- Somewhere-near-kargil to Leh ( Shared cab) 500
- Leh to Keylong (HPTDC bus) 470
- Keylong to Delhi (HPTDC bus) 485
Stay : 1240
[at Jammu( 3 days)= 550; at Drass(1 night) = 100; at Leh(1 night) = 50; at Keylong (1 night) = 40; at Delhi (1 day) = 600]
Food : 1300
Total Expenses : approx 9000 INR
June 12, 2009
Decaying organic matter
Today, I feel like small chunk of compost in a bigger pile of shite.
Woke up to ASMZ and GYBE still reverberating in my pigeonhole apartment. I was unable to enjoy them today morning. There was something wrong. Nothing wrong with yesterday - Thursdays nice to me. A shave, the cologne, branded clothing...reebok tshirt, shoes, levis trousers -- i was not wearing clothes. I was a walking advertisement. A 'thing' who needed other 'things'.
'The core of mans' spirit comes from new experiences.....I walk away quietly into empty spaces, trying to close the gaps of the past.'
I saw 'Into the Wild' again. The masterpiece which has had a profound impact on me, and the protagonist with whom i can easily connect to. Each and every line uttered in the movie is a jewel. Have never seen a better definition of 'love'. Makes me wonder of its existence!
'am going to paraphrase Thoreau here... rather than love, than money, than faith, than fame, than fairness... give me truth. '
What is TRUTH? Is the quest for TRUTH a dangerous journey? What is danger?
Questions and more Questions ... that are easy to ask, but the answers when deciphered can lead to more thirst and endless journeys.
Yes - I am in the same heap. The same pile of maggots who wants to be different for the heck of it! Unique snowflakes, eh?! The same pile of numb shackling schmucks who show off more than their capabilities. The entire spectrum of social numbnuts who 'try' to appear cool and hep. Sick desperations. Attention deficit disorders.
Why am I in the heap? The answers. I am afraid of the answers.
I shall rise and raise. Disclaimers have become a norm. Sometimes, losing all hope leads to salvation...freedom. As Tylor Durden says 'let the chips fall where they may.'
Lets evolve...but into what?
Woke up to ASMZ and GYBE still reverberating in my pigeonhole apartment. I was unable to enjoy them today morning. There was something wrong. Nothing wrong with yesterday - Thursdays nice to me. A shave, the cologne, branded clothing...reebok tshirt, shoes, levis trousers -- i was not wearing clothes. I was a walking advertisement. A 'thing' who needed other 'things'.
'The core of mans' spirit comes from new experiences.....I walk away quietly into empty spaces, trying to close the gaps of the past.'
I saw 'Into the Wild' again. The masterpiece which has had a profound impact on me, and the protagonist with whom i can easily connect to. Each and every line uttered in the movie is a jewel. Have never seen a better definition of 'love'. Makes me wonder of its existence!
'am going to paraphrase Thoreau here... rather than love, than money, than faith, than fame, than fairness... give me truth. '
What is TRUTH? Is the quest for TRUTH a dangerous journey? What is danger?
Questions and more Questions ... that are easy to ask, but the answers when deciphered can lead to more thirst and endless journeys.
Yes - I am in the same heap. The same pile of maggots who wants to be different for the heck of it! Unique snowflakes, eh?! The same pile of numb shackling schmucks who show off more than their capabilities. The entire spectrum of social numbnuts who 'try' to appear cool and hep. Sick desperations. Attention deficit disorders.
Why am I in the heap? The answers. I am afraid of the answers.
I shall rise and raise. Disclaimers have become a norm. Sometimes, losing all hope leads to salvation...freedom. As Tylor Durden says 'let the chips fall where they may.'
Lets evolve...but into what?
May 18, 2009
Crimson Red
The darkness in the midst of the white snow,
Lay the Master and his foe,
For once shall they seek the pride,
Dream that they will, before their final ride.
And the skies soared with eternal roar,
Brothers they were, before the war,
Too late, the greed left the nasty scar,
Bugles played their best, before they lay their enemies to rest,
Masqueraders punished, traitors stoned,
Women raped, kids guillotined,
Filth and rats in the streets galore,
Darkness shall play when the dawn bemoan.
For, He has mistaken his identity, serenity is nothing but a rarity,
Origins were doubted and hence the destiny, Not once will it be claimed a victory.
Lay the Master and his foe,
For once shall they seek the pride,
Dream that they will, before their final ride.
And the skies soared with eternal roar,
Brothers they were, before the war,
Too late, the greed left the nasty scar,
Bugles played their best, before they lay their enemies to rest,
Masqueraders punished, traitors stoned,
Women raped, kids guillotined,
Filth and rats in the streets galore,
Darkness shall play when the dawn bemoan.
For, He has mistaken his identity, serenity is nothing but a rarity,
Origins were doubted and hence the destiny, Not once will it be claimed a victory.
May 05, 2009
Norwegian Blue Parrot
Nope - this blog is not dead yet. Neither did it go to meet its maker.
It is just ruminating about all the things in life.
It shall sprout up with life soon(read 'few days'), for it cannot be idle.
It is just ruminating about all the things in life.
It shall sprout up with life soon(read 'few days'), for it cannot be idle.
January 11, 2009
Courage is NOT victory
M.J.Akbar is probably one of the best writers(along with the likes of Gurumurthy, Arun Shourie et al) presently in India, whom i admire and appreciate the most. His choice of words and technicality of his articles are a pleasure to read and ponder. He is probably the only prolific Islamic Indian writer of the contemporary times who is insightful, understands his religion and the worlds affairs sincerely.
His latest editorial in today's(Sunday, Jan 11, 2009) Times of India(Chennai Edition) is worth a read. Check him out here.
I loved the way he ended his article : "Men die for two diametrically opposed reasons: when they value what they seek to defend, and when there is nothing worth living for. Israel has created a state worth defending. The Palestinians must be given something to live for. "
His latest editorial in today's(Sunday, Jan 11, 2009) Times of India(Chennai Edition) is worth a read. Check him out here.
I loved the way he ended his article : "Men die for two diametrically opposed reasons: when they value what they seek to defend, and when there is nothing worth living for. Israel has created a state worth defending. The Palestinians must be given something to live for. "
October 25, 2008
Jackdaws
The day was gone
The night came on
The monks and the friars, they searched till dawn
When the sacristan saw
On crumpled claw
Come limping a poor little lame jackdaw
No longer gay
As on yesterday
His feathers all seemed to be turned the wrong way
His pinions dropped, he could hardly stand
His head was as bald as the palm of your hand
His eye so dim
So wasted each limb
That, heedless of grammar, they all cried : :That's Him!"
- Ken Follet
The night came on
The monks and the friars, they searched till dawn
When the sacristan saw
On crumpled claw
Come limping a poor little lame jackdaw
No longer gay
As on yesterday
His feathers all seemed to be turned the wrong way
His pinions dropped, he could hardly stand
His head was as bald as the palm of your hand
His eye so dim
So wasted each limb
That, heedless of grammar, they all cried : :That's Him!"
- Ken Follet
Subscribe to:
Posts (Atom)